Version express
Allons à l'essentiel...
L'indice de la qualité de l'air ambiant dans les villes wallonnes
| Valeur limite annuelle : 6 ng/m³ | 2025 | 2024 | 2023 | 2022 | ||||
|---|---|---|---|---|---|---|---|---|
| Province du Brabant Wallon | ||||||||
| Corroy-le-Grand | n/a | n/a | n/a | 0.18 | ||||
| Province du Hainaut | ||||||||
| Ath | 0.45 | 0.33 | 0.41 | 0.41 | ||||
| Charleroi | 0.30 | 0.29 | 0.30 | 0.36 | ||||
| Havinnes | 0.29 | 0.25 | 0.27 | 0.35 | ||||
| Lodelinsart | 0.30 | 0.29 | 0.32 | 0.41 | ||||
| Mons | 0.29 | 0.25 | 0.27 | 0.34 | ||||
| Province de Liège | ||||||||
| Engis | 0.37 | 0.29 | 0.36 | 0.44 | ||||
| Jemeppe-sur-Meuse | 0.40 | 0.35 | 0.34 | 0.43 | ||||
| Saint-Nicolas | 0.34 | 0.30 | 0.30 | 0.36 | ||||
| Province du Luxembourg | ||||||||
| Habay-la-Vieille | 0.19 | 0.15 | 0.17 | 0.19 | ||||
| Petit-Thier | 0.16 | 0.15 | 0.15 | 0.19 | ||||
| Province de Namur | ||||||||
| Dourbes | 0.20 | 0.20 | 0.21 | 0.29 | ||||
| Namur | 0.23 | 0.21 | 0.25 | 0.31 | ||||
| Sclaigneaux | n/a | 0.34 | 0.34 | 0.43 | ||||
| Sclaigneaux | 0.32 | n/a | n/a | n/a | ||||
| Sinsin | 0.19 | 0.18 | 0.18 | 0.23 | ||||
| Valeur limite annuelle : 5 ng/m³ | 2025 | 2024 | 2023 | 2022 | ||||
|---|---|---|---|---|---|---|---|---|
| Province du Brabant Wallon | ||||||||
| Corroy-le-Grand | n/a | n/a | n/a | 0.11 | ||||
| Province du Hainaut | ||||||||
| Ath | 1.83 | 1.62 | 1.19 | 1.01 | ||||
| Charleroi | 0.13 | 0.14 | 0.20 | 0.23 | ||||
| Havinnes | 0.10 | 0.09 | 0.11 | 0.15 | ||||
| Lodelinsart | 0.14 | 0.14 | 0.22 | 0.29 | ||||
| Mons | 0.12 | 0.10 | 0.15 | 0.13 | ||||
| Province de Liège | ||||||||
| Engis | 0.52 | 0.45 | 0.39 | 0.58 | ||||
| Jemeppe-sur-Meuse | 0.18 | 0.14 | 0.17 | 0.20 | ||||
| Saint-Nicolas | 0.14 | 0.12 | 0.12 | 0.14 | ||||
| Province du Luxembourg | ||||||||
| Habay-la-Vieille | 0.04 | 0.07 | 0.16 | 0.05 | ||||
| Petit-Thier | 0.05 | 0.09 | 0.08 | 0.06 | ||||
| Province de Namur | ||||||||
| Dourbes | 0.10 | 0.10 | 0.09 | 0.10 | ||||
| Namur | 0.08 | 0.08 | 0.10 | 0.19 | ||||
| Sclaigneaux | n/a | 0.32 | 0.55 | 1.17 | ||||
| Sclaigneaux | 0.13 | n/a | n/a | n/a | ||||
| Sinsin | 0.06 | 0.06 | 0.20 | 0.08 | ||||
| Valeur limite annuelle : 20 ng/m³ | 2025 | 2024 | 2023 | 2022 | ||||
|---|---|---|---|---|---|---|---|---|
| Province du Brabant Wallon | ||||||||
| Corroy-le-Grand | n/a | n/a | n/a | 2.12 | ||||
| Province du Hainaut | ||||||||
| Ath | 2.56 | 3.26 | 2.98 | 4.13 | ||||
| Charleroi | 5.55 | 4.23 | 3.32 | 5.42 | ||||
| Havinnes | 0.77 | 0.87 | 0.70 | 0.93 | ||||
| Lodelinsart | 7.06 | 6.64 | 4.75 | 7.77 | ||||
| Mons | 1.62 | 1.22 | 1.08 | 1.35 | ||||
| Province de Liège | ||||||||
| Engis | 0.99 | 0.83 | 0.87 | 1.18 | ||||
| Jemeppe-sur-Meuse | 1.12 | 1.01 | 0.98 | 1.14 | ||||
| Saint-Nicolas | 0.94 | 0.95 | 0.78 | 0.95 | ||||
| Province du Luxembourg | ||||||||
| Habay-la-Vieille | 0.54 | 0.57 | 0.45 | 0.54 | ||||
| Petit-Thier | 0.39 | 0.54 | 0.55 | 0.56 | ||||
| Province de Namur | ||||||||
| Dourbes | 0.61 | 0.55 | 0.59 | 0.58 | ||||
| Namur | 0.90 | 1.11 | 0.95 | 1.36 | ||||
| Sclaigneaux | n/a | 1.39 | 1.21 | 1.63 | ||||
| Sclaigneaux | 0.88 | n/a | n/a | n/a | ||||
| Sinsin | 0.48 | 0.58 | 0.53 | 0.61 | ||||
| Valeur limite annuelle : 500 ng/m³ | 2025 | 2024 | 2023 | 2022 | ||||
|---|---|---|---|---|---|---|---|---|
| Province du Brabant Wallon | ||||||||
| Corroy-le-Grand | n/a | n/a | n/a | 2.39 | ||||
| Province du Hainaut | ||||||||
| Ath | 5.71 | 3.02 | 2.83 | 4.24 | ||||
| Charleroi | 5.94 | 4.85 | 5.30 | 7.15 | ||||
| Havinnes | 2.63 | 2.19 | 2.27 | 3.43 | ||||
| Lodelinsart | 5.54 | 4.97 | 6.79 | 9.01 | ||||
| Mons | 6.23 | 2.80 | 3.39 | 4.89 | ||||
| Province de Liège | ||||||||
| Engis | 10.14 | 7.30 | 7.91 | 10.00 | ||||
| Jemeppe-sur-Meuse | 5.24 | 4.44 | 4.38 | 7.35 | ||||
| Saint-Nicolas | 4.74 | 3.66 | 3.97 | 5.55 | ||||
| Province du Luxembourg | ||||||||
| Habay-la-Vieille | 1.49 | 1.50 | 1.33 | 1.95 | ||||
| Petit-Thier | 1.36 | 1.39 | 1.15 | 1.91 | ||||
| Province de Namur | ||||||||
| Dourbes | 2.11 | 1.88 | 1.88 | 2.72 | ||||
| Namur | 2.64 | 3.49 | 3.18 | 4.73 | ||||
| Sclaigneaux | n/a | 3.17 | 3.71 | 4.83 | ||||
| Sclaigneaux | 3.90 | n/a | n/a | n/a | ||||
| Sinsin | 1.59 | 1.50 | 1.57 | 2.28 | ||||
| Valeur limite annuelle : 5 µg/m³ | 2025 | 2024 | 2023 | 2022 | ||||
|---|---|---|---|---|---|---|---|---|
| Province du Brabant Wallon | ||||||||
| Corroy-le-Grand | n/a | n/a | n/a | 0.32 | ||||
| Province du Hainaut | ||||||||
| Charleroi | 0.65 | 0.64 | 0.60 | 0.67 | ||||
| Havinnes | 0.51 | 0.46 | 0.43 | 0.49 | ||||
| Lodelinsart | 0.83 | 0.72 | 0.68 | 0.66 | ||||
| Mons | 0.64 | 0.60 | 0.63 | 0.59 | ||||
| Mouscron | 0.61 | 0.55 | 0.53 | 0.59 | ||||
| Province de Liège | ||||||||
| Angleur | 0.63 | 0.59 | 0.51 | 0.59 | ||||
| Engis | 0.57 | 0.58 | 0.47 | 0.54 | ||||
| Eupen | 0.44 | 0.41 | 0.43 | 0.38 | ||||
| Herstal | 0.79 | 0.74 | 0.65 | 0.68 | ||||
| Province du Luxembourg | ||||||||
| Petit-Thier | 0.35 | 0.36 | 0.33 | 0.34 | ||||
| Province de Namur | ||||||||
| Dourbes | 0.43 | 0.40 | 0.34 | 0.39 | ||||
| Namur | 0.62 | 0.59 | 0.53 | 0.57 | ||||
| Valeur limite annuelle : 1 ng/m³ | 2025 | 2024 | 2023 | 2022 | ||||
|---|---|---|---|---|---|---|---|---|
| Province du Brabant Wallon | ||||||||
| Corroy-le-Grand | n/a | n/a | n/a | n/a | ||||
| Province du Hainaut | ||||||||
| Lodelinsart | 0.14 | 0.17 | 0.11 | 0.31 | ||||
| Marcinelle | 0.07 | 0.09 | 0.08 | 0.18 | ||||
| Province de Liège | ||||||||
| Angleur | 0.13 | 0.10 | 0.14 | 0.14 | ||||
| Herstal | 0.14 | 0.14 | 0.12 | 0.16 | ||||
| Robertville | 0.02 | 0.01 | 0.01 | 0.02 | ||||
| Province du Luxembourg | ||||||||
| Petit-Thier | 0.03 | 0.06 | 0.02 | 0.03 | ||||
| Province de Namur | ||||||||
| Dourbes | 0.04 | 0.04 | 0.04 | 0.07 | ||||
| Namur | 0.09 | 0.11 | 0.07 | 0.19 | ||||
| Sinsin | 0.05 | 0.05 | 0.05 | 0.08 | ||||
 Rapports annuels des réseaux de surveillance de la Qualité de l'Air en Wallonie
Voici les rapports annuels d'activité des réseaux de surveillance de la Qualité de l'Air en...
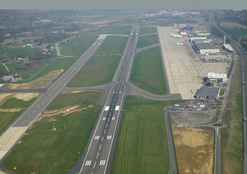
 Rapport sur la Qualité de l'Air dans la zone de l'aéroport de Charleroi
Ci-dessous, sont repris les rapports annuels et/ou semestriels en version PDF concernant la...
 Rapport sur la Qualité de l'Air dans la zone de l'aéroport de Liège (Liège Airport)
Ci-dessous, sont repris les rapports annuels en version PDF concernant la qualité de l'air ambiant dans la...
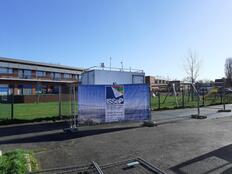
 Rapport sur la Qualité de l'Air dans la commune de Rixensart
Depuis le 23 février 2022, une station de mesures de la qualité de l’air ambiant a été installée...


