

Express version
Let's get to the point...
The ambient air quality index in Walloon cities
| Valeur limite annuelle : 6 ng/m³ | 2025 | 2024 | 2023 | 2022 | ||||
|---|---|---|---|---|---|---|---|---|
| Province of Walloon Brabant | ||||||||
| Corroy-le-Grand | n/a | n/a | n/a | 0.18 | ||||
| Province of Hainaut | ||||||||
| Ath | 0.40 | 0.33 | 0.41 | 0.41 | ||||
| Charleroi | 0.21 | 0.29 | 0.30 | 0.36 | ||||
| Havinnes | 0.28 | 0.25 | 0.27 | 0.35 | ||||
| Lodelinsart | 0.37 | 0.29 | 0.32 | 0.41 | ||||
| Mons | 0.15 | 0.25 | 0.27 | 0.34 | ||||
| Province of Liège | ||||||||
| Engis | 0.37 | 0.29 | 0.36 | 0.44 | ||||
| Jemeppe-sur-Meuse | 0.36 | 0.35 | 0.34 | 0.43 | ||||
| Saint-Nicolas | 0.31 | 0.30 | 0.30 | 0.36 | ||||
| Province of Luxembourg | ||||||||
| Habay-la-Vieille | 0.16 | 0.15 | 0.17 | 0.19 | ||||
| Petit-Thier | 0.13 | 0.15 | 0.15 | 0.19 | ||||
| Province of Namur | ||||||||
| Dourbes | 0.27 | 0.20 | 0.21 | 0.29 | ||||
| Namur | 0.22 | 0.21 | 0.25 | 0.31 | ||||
| Sclaigneaux | n/a | 0.34 | 0.34 | 0.43 | ||||
| Sinsin | 0.17 | 0.18 | 0.18 | 0.23 | ||||
| Valeur limite annuelle : 5 ng/m³ | 2025 | 2024 | 2023 | 2022 | ||||
|---|---|---|---|---|---|---|---|---|
| Province of Walloon Brabant | ||||||||
| Corroy-le-Grand | n/a | n/a | n/a | 0.11 | ||||
| Province of Hainaut | ||||||||
| Ath | 1.20 | 1.62 | 1.19 | 1.01 | ||||
| Charleroi | 0.20 | 0.14 | 0.20 | 0.23 | ||||
| Havinnes | 0.22 | 0.09 | 0.11 | 0.15 | ||||
| Lodelinsart | 0.31 | 0.14 | 0.22 | 0.29 | ||||
| Mons | 0.14 | 0.10 | 0.15 | 0.13 | ||||
| Province of Liège | ||||||||
| Engis | 0.27 | 0.45 | 0.39 | 0.58 | ||||
| Jemeppe-sur-Meuse | 0.12 | 0.14 | 0.17 | 0.20 | ||||
| Saint-Nicolas | 0.10 | 0.12 | 0.12 | 0.14 | ||||
| Province of Luxembourg | ||||||||
| Habay-la-Vieille | 0.05 | 0.07 | 0.16 | 0.05 | ||||
| Petit-Thier | 0.06 | 0.09 | 0.08 | 0.06 | ||||
| Province of Namur | ||||||||
| Dourbes | 0.15 | 0.10 | 0.09 | 0.10 | ||||
| Namur | 0.12 | 0.08 | 0.10 | 0.19 | ||||
| Sclaigneaux | n/a | 0.32 | 0.55 | 1.17 | ||||
| Sinsin | 0.08 | 0.06 | 0.20 | 0.08 | ||||
| Valeur limite annuelle : 20 ng/m³ | 2025 | 2024 | 2023 | 2022 | ||||
|---|---|---|---|---|---|---|---|---|
| Province of Walloon Brabant | ||||||||
| Corroy-le-Grand | n/a | n/a | n/a | 2.12 | ||||
| Province of Hainaut | ||||||||
| Ath | 3.41 | 3.26 | 2.98 | 4.13 | ||||
| Charleroi | 1.91 | 4.23 | 3.32 | 5.42 | ||||
| Havinnes | 0.50 | 0.87 | 0.70 | 0.93 | ||||
| Lodelinsart | 17.17 | 6.64 | 4.75 | 7.77 | ||||
| Mons | 0.78 | 1.22 | 1.08 | 1.35 | ||||
| Province of Liège | ||||||||
| Engis | 0.91 | 0.83 | 0.87 | 1.18 | ||||
| Jemeppe-sur-Meuse | 0.76 | 1.01 | 0.98 | 1.14 | ||||
| Saint-Nicolas | 0.68 | 0.95 | 0.78 | 0.95 | ||||
| Province of Luxembourg | ||||||||
| Habay-la-Vieille | 0.38 | 0.57 | 0.45 | 0.54 | ||||
| Petit-Thier | 0.28 | 0.54 | 0.55 | 0.56 | ||||
| Province of Namur | ||||||||
| Dourbes | 1.09 | 0.55 | 0.59 | 0.58 | ||||
| Namur | 0.85 | 1.11 | 0.95 | 1.36 | ||||
| Sclaigneaux | n/a | 1.39 | 1.21 | 1.63 | ||||
| Sinsin | 0.33 | 0.58 | 0.53 | 0.61 | ||||
| Valeur limite annuelle : 500 ng/m³ | 2025 | 2024 | 2023 | 2022 | ||||
|---|---|---|---|---|---|---|---|---|
| Province of Walloon Brabant | ||||||||
| Corroy-le-Grand | n/a | n/a | n/a | 2.39 | ||||
| Province of Hainaut | ||||||||
| Ath | 6.07 | 3.02 | 2.83 | 4.24 | ||||
| Charleroi | 6.86 | 4.85 | 5.30 | 7.15 | ||||
| Havinnes | 5.08 | 2.19 | 2.27 | 3.43 | ||||
| Lodelinsart | 14.22 | 4.97 | 6.79 | 9.01 | ||||
| Mons | 4.74 | 2.80 | 3.39 | 4.89 | ||||
| Province of Liège | ||||||||
| Engis | 8.16 | 7.30 | 7.91 | 10.00 | ||||
| Jemeppe-sur-Meuse | 3.59 | 4.44 | 4.38 | 7.35 | ||||
| Saint-Nicolas | 3.52 | 3.66 | 3.97 | 5.55 | ||||
| Province of Luxembourg | ||||||||
| Habay-la-Vieille | 1.85 | 1.50 | 1.33 | 1.95 | ||||
| Petit-Thier | 1.60 | 1.39 | 1.15 | 1.91 | ||||
| Province of Namur | ||||||||
| Dourbes | 5.31 | 1.88 | 1.88 | 2.72 | ||||
| Namur | 3.85 | 3.49 | 3.18 | 4.73 | ||||
| Sclaigneaux | n/a | 3.17 | 3.71 | 4.83 | ||||
| Sinsin | 2.03 | 1.50 | 1.57 | 2.28 | ||||
| Valeur limite annuelle : 5 µg/m³ | 2025 | 2024 | 2023 | 2022 | ||||
|---|---|---|---|---|---|---|---|---|
| Province of Walloon Brabant | ||||||||
| Corroy-le-Grand | n/a | n/a | n/a | 0.32 | ||||
| Province of Hainaut | ||||||||
| Charleroi | 0.97 | 0.64 | 0.60 | 0.67 | ||||
| Havinnes | 1.22 | 0.46 | 0.43 | 0.49 | ||||
| Lodelinsart | 1.28 | 0.72 | 0.68 | 0.66 | ||||
| Mons | 0.91 | 0.60 | 0.63 | 0.59 | ||||
| Mouscron | 0.96 | 0.55 | 0.53 | 0.59 | ||||
| Province of Liège | ||||||||
| Angleur | 0.95 | 0.59 | 0.51 | 0.59 | ||||
| Engis | 0.87 | 0.58 | 0.47 | 0.54 | ||||
| Eupen | 0.61 | 0.41 | 0.43 | 0.38 | ||||
| Herstal | 1.05 | 0.74 | 0.65 | 0.68 | ||||
| Province of Luxembourg | ||||||||
| Petit-Thier | 0.49 | 0.36 | 0.33 | 0.34 | ||||
| Province of Namur | ||||||||
| Dourbes | 0.64 | 0.40 | 0.34 | 0.39 | ||||
| Namur | 0.93 | 0.59 | 0.53 | 0.57 | ||||
| Valeur limite annuelle : 1 ng/m³ | 2025 | 2024 | 2023 | 2022 | ||||
|---|---|---|---|---|---|---|---|---|
| Province of Walloon Brabant | ||||||||
| Corroy-le-Grand | n/a | n/a | n/a | n/a | ||||
| Province of Hainaut | ||||||||
| Lodelinsart | 0.36 | 0.17 | 0.11 | 0.31 | ||||
| Marcinelle | 0.21 | 0.09 | 0.08 | 0.18 | ||||
| Province of Liège | ||||||||
| Angleur | 0.36 | 0.10 | 0.14 | 0.14 | ||||
| Herstal | 0.30 | 0.14 | 0.12 | 0.16 | ||||
| Robertville | 0.04 | 0.01 | 0.01 | 0.02 | ||||
| Province of Luxembourg | ||||||||
| Petit-Thier | 0.06 | 0.06 | 0.02 | 0.03 | ||||
| Province of Namur | ||||||||
| Dourbes | 0.10 | 0.04 | 0.04 | 0.07 | ||||
| Namur | 0.22 | 0.11 | 0.07 | 0.19 | ||||
| Sinsin | 0.14 | 0.05 | 0.05 | 0.08 | ||||
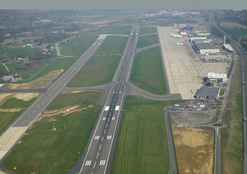 Report on Air Quality in the area of Liège Airport
Below are the annual reports (only in french) in PDF version concerning the monitoring of the...
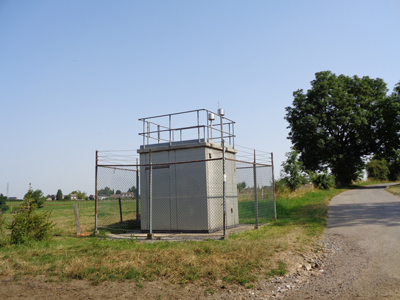
 Report on Air Quality in the area of Charleroi Airport
Below are the annual and/or half-year reports (only available in french) in PDF version concerning the...
 Air Quality monitoring networks in Wallonia - Annual reports
Below, the annual activity report of the Air Quality monitoring networks in Wallonia in PDF...
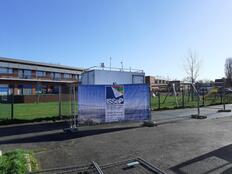 Report on Air Quality in the municipality of Rixensart
Since 23 February 2022, an ambient air quality measurement station has been installed in the...