

Express-Version
Kommen wir auf den Punkt...
Der Luftqualitätsindex in wallonischen Städten
| Valeur limite annuelle : 6 ng/m³ | 2025 | 2024 | 2023 | 2022 | ||||
|---|---|---|---|---|---|---|---|---|
| Provinz Wallonisch-Brabant | ||||||||
| Corroy-le-Grand | n/a | n/a | n/a | 0.18 | ||||
| Provinz Hennegau | ||||||||
| Ath | 0.40 | 0.33 | 0.41 | 0.41 | ||||
| Charleroi | 0.21 | 0.29 | 0.30 | 0.36 | ||||
| Havinnes | 0.28 | 0.25 | 0.27 | 0.35 | ||||
| Lodelinsart | 0.37 | 0.29 | 0.32 | 0.41 | ||||
| Mons | 0.15 | 0.25 | 0.27 | 0.34 | ||||
| Provinz Lüttich | ||||||||
| Engis | 0.37 | 0.29 | 0.36 | 0.44 | ||||
| Jemeppe-sur-Meuse | 0.36 | 0.35 | 0.34 | 0.43 | ||||
| Saint-Nicolas | 0.31 | 0.30 | 0.30 | 0.36 | ||||
| Provinz Luxemburg | ||||||||
| Habay-la-Vieille | 0.16 | 0.15 | 0.17 | 0.19 | ||||
| Petit-Thier | 0.13 | 0.15 | 0.15 | 0.19 | ||||
| Provinz Namur | ||||||||
| Dourbes | 0.27 | 0.20 | 0.21 | 0.29 | ||||
| Namur | 0.22 | 0.21 | 0.25 | 0.31 | ||||
| Sclaigneaux | n/a | 0.34 | 0.34 | 0.43 | ||||
| Sinsin | 0.17 | 0.18 | 0.18 | 0.23 | ||||
| Valeur limite annuelle : 5 ng/m³ | 2025 | 2024 | 2023 | 2022 | ||||
|---|---|---|---|---|---|---|---|---|
| Provinz Wallonisch-Brabant | ||||||||
| Corroy-le-Grand | n/a | n/a | n/a | 0.11 | ||||
| Provinz Hennegau | ||||||||
| Ath | 1.20 | 1.62 | 1.19 | 1.01 | ||||
| Charleroi | 0.20 | 0.14 | 0.20 | 0.23 | ||||
| Havinnes | 0.22 | 0.09 | 0.11 | 0.15 | ||||
| Lodelinsart | 0.31 | 0.14 | 0.22 | 0.29 | ||||
| Mons | 0.14 | 0.10 | 0.15 | 0.13 | ||||
| Provinz Lüttich | ||||||||
| Engis | 0.27 | 0.45 | 0.39 | 0.58 | ||||
| Jemeppe-sur-Meuse | 0.12 | 0.14 | 0.17 | 0.20 | ||||
| Saint-Nicolas | 0.10 | 0.12 | 0.12 | 0.14 | ||||
| Provinz Luxemburg | ||||||||
| Habay-la-Vieille | 0.05 | 0.07 | 0.16 | 0.05 | ||||
| Petit-Thier | 0.06 | 0.09 | 0.08 | 0.06 | ||||
| Provinz Namur | ||||||||
| Dourbes | 0.15 | 0.10 | 0.09 | 0.10 | ||||
| Namur | 0.12 | 0.08 | 0.10 | 0.19 | ||||
| Sclaigneaux | n/a | 0.32 | 0.55 | 1.17 | ||||
| Sinsin | 0.08 | 0.06 | 0.20 | 0.08 | ||||
| Valeur limite annuelle : 20 ng/m³ | 2025 | 2024 | 2023 | 2022 | ||||
|---|---|---|---|---|---|---|---|---|
| Provinz Wallonisch-Brabant | ||||||||
| Corroy-le-Grand | n/a | n/a | n/a | 2.12 | ||||
| Provinz Hennegau | ||||||||
| Ath | 3.41 | 3.26 | 2.98 | 4.13 | ||||
| Charleroi | 1.91 | 4.23 | 3.32 | 5.42 | ||||
| Havinnes | 0.50 | 0.87 | 0.70 | 0.93 | ||||
| Lodelinsart | 17.17 | 6.64 | 4.75 | 7.77 | ||||
| Mons | 0.78 | 1.22 | 1.08 | 1.35 | ||||
| Provinz Lüttich | ||||||||
| Engis | 0.91 | 0.83 | 0.87 | 1.18 | ||||
| Jemeppe-sur-Meuse | 0.76 | 1.01 | 0.98 | 1.14 | ||||
| Saint-Nicolas | 0.68 | 0.95 | 0.78 | 0.95 | ||||
| Provinz Luxemburg | ||||||||
| Habay-la-Vieille | 0.38 | 0.57 | 0.45 | 0.54 | ||||
| Petit-Thier | 0.28 | 0.54 | 0.55 | 0.56 | ||||
| Provinz Namur | ||||||||
| Dourbes | 1.09 | 0.55 | 0.59 | 0.58 | ||||
| Namur | 0.85 | 1.11 | 0.95 | 1.36 | ||||
| Sclaigneaux | n/a | 1.39 | 1.21 | 1.63 | ||||
| Sinsin | 0.33 | 0.58 | 0.53 | 0.61 | ||||
| Valeur limite annuelle : 500 ng/m³ | 2025 | 2024 | 2023 | 2022 | ||||
|---|---|---|---|---|---|---|---|---|
| Provinz Wallonisch-Brabant | ||||||||
| Corroy-le-Grand | n/a | n/a | n/a | 2.39 | ||||
| Provinz Hennegau | ||||||||
| Ath | 6.07 | 3.02 | 2.83 | 4.24 | ||||
| Charleroi | 6.86 | 4.85 | 5.30 | 7.15 | ||||
| Havinnes | 5.08 | 2.19 | 2.27 | 3.43 | ||||
| Lodelinsart | 14.22 | 4.97 | 6.79 | 9.01 | ||||
| Mons | 4.74 | 2.80 | 3.39 | 4.89 | ||||
| Provinz Lüttich | ||||||||
| Engis | 8.16 | 7.30 | 7.91 | 10.00 | ||||
| Jemeppe-sur-Meuse | 3.59 | 4.44 | 4.38 | 7.35 | ||||
| Saint-Nicolas | 3.52 | 3.66 | 3.97 | 5.55 | ||||
| Provinz Luxemburg | ||||||||
| Habay-la-Vieille | 1.85 | 1.50 | 1.33 | 1.95 | ||||
| Petit-Thier | 1.60 | 1.39 | 1.15 | 1.91 | ||||
| Provinz Namur | ||||||||
| Dourbes | 5.31 | 1.88 | 1.88 | 2.72 | ||||
| Namur | 3.85 | 3.49 | 3.18 | 4.73 | ||||
| Sclaigneaux | n/a | 3.17 | 3.71 | 4.83 | ||||
| Sinsin | 2.03 | 1.50 | 1.57 | 2.28 | ||||
| Valeur limite annuelle : 5 µg/m³ | 2025 | 2024 | 2023 | 2022 | ||||
|---|---|---|---|---|---|---|---|---|
| Provinz Wallonisch-Brabant | ||||||||
| Corroy-le-Grand | n/a | n/a | n/a | 0.32 | ||||
| Provinz Hennegau | ||||||||
| Charleroi | 0.97 | 0.64 | 0.60 | 0.67 | ||||
| Havinnes | 1.22 | 0.46 | 0.43 | 0.49 | ||||
| Lodelinsart | 1.28 | 0.72 | 0.68 | 0.66 | ||||
| Mons | 0.91 | 0.60 | 0.63 | 0.59 | ||||
| Mouscron | 0.96 | 0.55 | 0.53 | 0.59 | ||||
| Provinz Lüttich | ||||||||
| Angleur | 0.95 | 0.59 | 0.51 | 0.59 | ||||
| Engis | 0.87 | 0.58 | 0.47 | 0.54 | ||||
| Eupen | 0.61 | 0.41 | 0.43 | 0.38 | ||||
| Herstal | 1.05 | 0.74 | 0.65 | 0.68 | ||||
| Provinz Luxemburg | ||||||||
| Petit-Thier | 0.49 | 0.36 | 0.33 | 0.34 | ||||
| Provinz Namur | ||||||||
| Dourbes | 0.64 | 0.40 | 0.34 | 0.39 | ||||
| Namur | 0.93 | 0.59 | 0.53 | 0.57 | ||||
| Valeur limite annuelle : 1 ng/m³ | 2025 | 2024 | 2023 | 2022 | ||||
|---|---|---|---|---|---|---|---|---|
| Provinz Wallonisch-Brabant | ||||||||
| Corroy-le-Grand | n/a | n/a | n/a | n/a | ||||
| Provinz Hennegau | ||||||||
| Lodelinsart | 0.36 | 0.17 | 0.11 | 0.31 | ||||
| Marcinelle | 0.21 | 0.09 | 0.08 | 0.18 | ||||
| Provinz Lüttich | ||||||||
| Angleur | 0.36 | 0.10 | 0.14 | 0.14 | ||||
| Herstal | 0.30 | 0.14 | 0.12 | 0.16 | ||||
| Robertville | 0.04 | 0.01 | 0.01 | 0.02 | ||||
| Provinz Luxemburg | ||||||||
| Petit-Thier | 0.06 | 0.06 | 0.02 | 0.03 | ||||
| Provinz Namur | ||||||||
| Dourbes | 0.10 | 0.04 | 0.04 | 0.07 | ||||
| Namur | 0.22 | 0.11 | 0.07 | 0.19 | ||||
| Sinsin | 0.14 | 0.05 | 0.05 | 0.08 | ||||
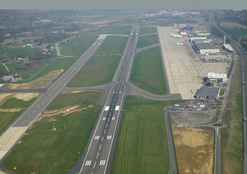 Bericht über die Luftqualität in der Umgebung des Flughafens Lüttich
Nachfolgend finden Sie die Jahresberichte über die Luftqualität im Gewerbegebiet des Flughafens...
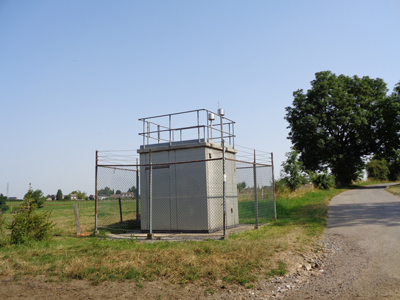
 Überwachung der Luftqualität in der Umgebung des Flughafens Charleroi - Jahresbericht
Nachfolgend finden Sie die Jahresberichte und/oder Halbjahresbericht über die Luftqualität im...
 Bericht der Netzwerke der Überwachung der Luftqualität in Wallonien
Hier sind die jährlichen Tätigkeitsberichte der Netze zur Überwachung der Luftqualität in...
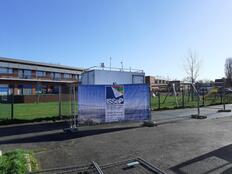 Bericht über die Luftqualität in der Gemeinde Rixensart
Seit dem 23. Februar 2022 ist in der Gemeinde Rixensart, genauer gesagt in der Rue des...